
Both models measure marketing performance. Both produce numbers that look authoritative. But they answer completely different questions, and choosing the wrong one for your situation means optimising for the wrong thing entirely.
Most marketing teams never choose between MTA and MMM deliberately. They inherit one, implement the other when pressure mounts, and end up reaching for whichever produces the more convenient number at any given moment. That is not a measurement strategy. It is organised confusion.
Start with one question: what business decision am I trying to make? The answer tells you which model to reach for and when you need both.
The core difference
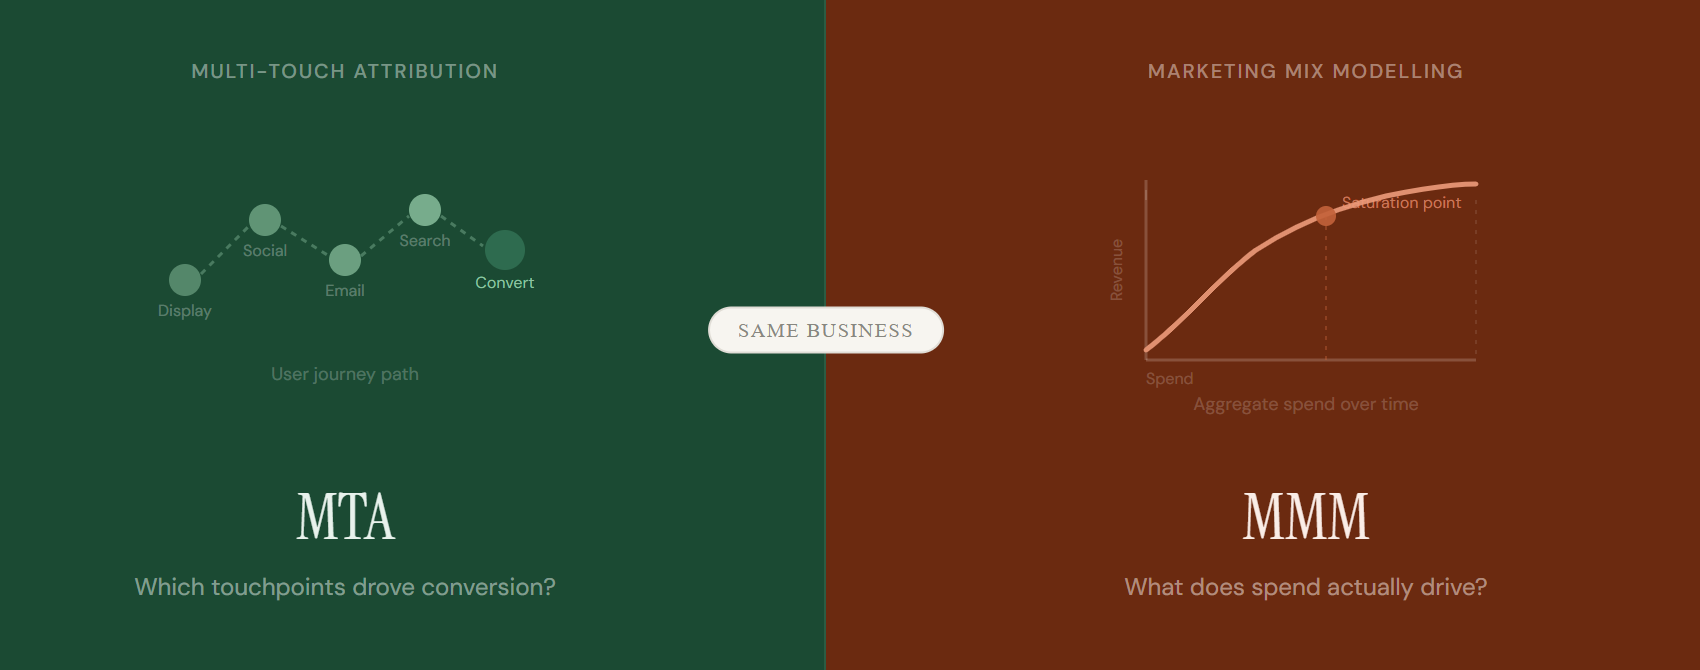
MTA asks: which touchpoints did converting users interact with on their path to purchase?
MMM asks: when we change how much we spend on a channel, what happens to total business outcomes?
MTA draws a map of the journey. MMM works as a lever for the budget.
What each model actually does
Multi-touch attribution tracks individual users across digital touchpoints. It follows the path from first impression to conversion and assigns credit to the channels and moments along the way. It is fast, granular, and built for optimisation. Ask it which ad creative pulls its weight this week, and it gives you a direct answer.
Marketing mix modelling does not track users at all. It takes aggregate spend across channels over time and models the statistical relationship between that spend and business outcomes. It captures the total effect of marketing, including channels that leave no digital footprint: TV, radio, out-of-home, sponsorships. Ask it where to put next year’s budget, and it gives you that answer instead.
Neither model is better. They calibrate for different decisions at different timescales. Using MTA to make annual budget calls is like using a speedometer to plan a road trip. It produces a number. Just not the one you need.
Use MTA when your decision is tactical
MTA is the right tool when you optimise something that is already running. It tells you which version of an ad converts better, which audience segment responds to which message, and how different digital channels sequence together on the path to purchase. It gives you the feedback loop you need at the speed you need it.
These signals point toward MTA
You optimise live campaigns and need weekly or daily feedback
Your media runs predominantly digital with reliable tracking in place
You want to understand channel sequencing and touchpoint contribution
You shift budget between digital channels in the short term
Your pixels, UTMs, and CRM IDs are consistently implemented
One important constraint. MTA only sees what it can track. Take a user who encounters your brand through a podcast, then a billboard, then a retargeting ad. MTA sees only the retargeting click and assigns all credit there. The further your media mix extends into offline or upper-funnel brand activity, the less MTA tells you about what actually drives results.
The tracking problem
Meta and Google do not share user-level data with your attribution tool. They share modelled estimates. The channels that likely drive your most volume are often the ones your MTA understands least. Keep that limitation in mind every time you read a channel attribution report.
Use MMM when your decision is strategic
MMM is the right tool when you plan rather than optimise. It tells you how much incremental revenue each channel generates at the margin, where your spend hits diminishing returns, and how your total marketing investment contributes to business outcomes across all media types. It does not tell you what to change this week. It tells you what to commit to next quarter.
These signals point toward MMM
You allocate annual or quarterly budgets across multiple channels
You run offline media like TV, radio, OOH or print alongside digital
You want to understand diminishing returns and optimal spend levels
You need a privacy-resilient measurement approach
You have at least two years of weekly spend and outcome data
Your total media budget exceeds roughly two million euros annually
That last point matters. MMM needs volume to find signal. Below roughly two million euros in annual media spend, the models often cannot isolate individual channel effects from background noise. Your MMM will confirm what you already suspected rather than reveal anything genuinely new. If your budget sits below that threshold, a well-run geo-experiment will usually tell you more.
When the answer is both
Most mid-to-large marketing teams need both models running at the same time. MTA optimises what is live. MMM informs what comes next. The risk is treating their outputs as competing versions of the truth rather than complementary answers to different questions.
When MTA says one thing and MMM says another, do not pick a winner. Ask which question each number is answering. MTA sees the path. MMM sees the impact. Both can be right simultaneously.
“The teams that measure best know what question they are asking before they look at the number.”
The most rigorous teams add a third method: controlled experiments. Geo-splits, holdout tests, and incrementality studies validate what both models say independently. When all three point in the same direction, you have a budget decision you can genuinely defend.
Using all three together
MTA
Which touchpoints contributed on the path to conversion? Optimise week to week.
MMM
What does spend actually drive at scale? Allocate budget quarter to quarter.
Experiments
What is truly incremental? Validate both models before a major budget call.
The bottom line
Start with the decision. The right model follows from that.
Optimising a live campaign this week? Reach for MTA. Planning next year’s channel mix? Run the MMM. Defending a major budget shift to your CFO? You want all three lenses pointing at the same answer.
Most measurement failures are not tool failures. They are teams using the right tool for the wrong question. Get the question right first. The model choice becomes obvious.
