
You spent weeks on the campaign. Briefed the designers, aligned stakeholders, got the green light. Then the data team looked at the results and said the numbers were not statistically significant. Here is what that actually means, and how to use it to make better decisions.
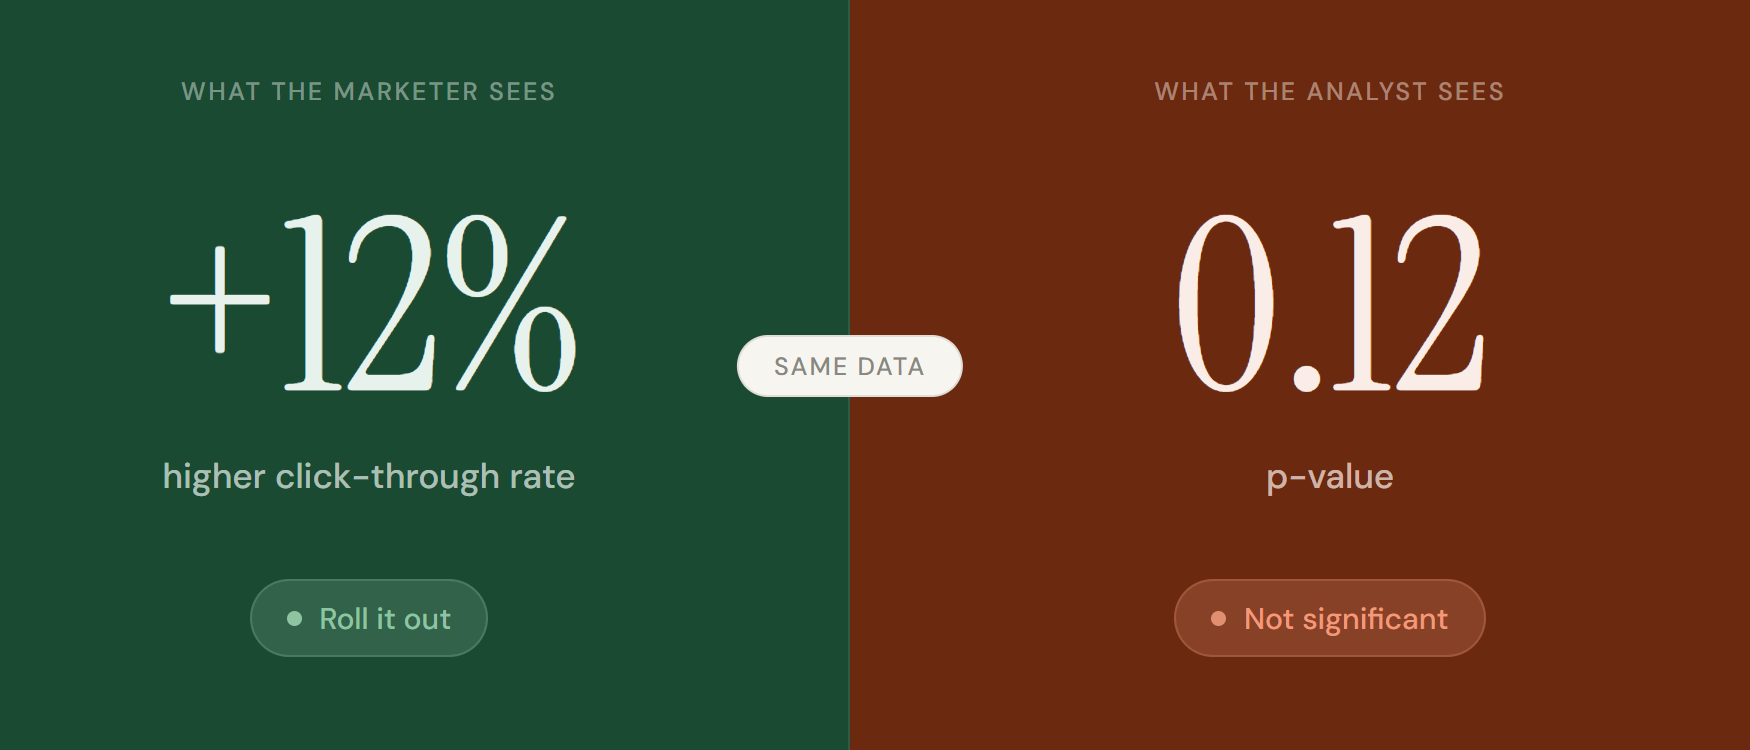
Picture this. You run an A/B test on two ad creatives. After two weeks, variant B shows a 12% higher click-through rate. You want to roll it out. The data team says no. The result is not statistically significant.
This conversation happens in marketing teams everywhere. And most of the frustration comes from one thing: marketers and analysts are answering different questions. The marketer sees a 12% difference and asks “is this real?” The analyst sees a p-value of 0.12 and answers “probably not.”
Understanding what sits between those two positions does not make you a statistician. It makes you a sharper decision-maker. And it changes every conversation you have with your data team.
What statistical significance is actually telling you
Every A/B test starts with two assumptions. The first is the null hypothesis: there is no real difference between variant A and variant B. The second is the alternative hypothesis: there is a real difference. Your test exists to figure out which one holds up.
Statistical significance tells you how likely your result is to have happened by chance alone. Not whether your result is good. Not whether it matters for the business. Just whether the observed difference is likely to be real or likely to be noise.
Your data team expresses this with a p-value. A p-value of 0.05 means there is a 5% chance your result happened by chance. A p-value of 0.20 means there is a 20% chance. The lower the p-value, the more confident you can be that the difference you observed is genuine.
Which threshold to use, and when to bend the rules?
Most people use 0.05 as their default significance threshold. It means you accept a 5% chance of acting on a false positive. That is a reasonable starting point, but it is not a law. The right threshold depends entirely on what is at stake.
The lower the p-value, the more confident you can be the result is real.
The question to ask before every test is not “what p-value do I need?” It is “what is the cost of being wrong?” The higher the cost of a false positive, the stricter your threshold should be.
Statistical significance is not the same as practical significance
This is the most important distinction in this entire article. And almost nobody talks about it clearly.
A result can clear your significance threshold and still be completely useless. Imagine you run a test with 500,000 users. Variant B shows a statistically significant 0.3% improvement in conversion rate. Your p-value is 0.02. The data team calls it significant. But 0.3% on your current conversion volume generates an extra €800 per month. The engineering work to implement the change costs €15,000. No sane business makes that call.
The metric you are missing is effect size: the magnitude of the difference, not just the reliability of it. A result worth acting on needs to be both statistically significant and large enough to move your business.
Three ways tests go wrong, and how to avoid them
Three things to do differently starting Monday
What it costs to ignore this
Marketing teams that do not understand statistical significance make two expensive mistakes. They kill good ideas too early because a result looks flat before the sample is large enough. And they roll out bad ideas with confidence because a result looked significant before it was stable.
Both mistakes cost money. The first one kills the kind of incremental optimisation that compounds into real competitive advantage over time. The second one sends budget into changes that do not work, and sometimes actively makes things worse.
Getting this right does not require becoming a statistician. It requires asking better questions before a test starts, and resisting the urge to act on results before they are ready to be acted on.
The bottom line
Statistical significance is not a barrier your data team puts up. It is the standard that makes your wins defensible.
When a result is statistically significant and practically meaningful, you can walk into any budget conversation and defend the decision with evidence. When it is not, acting anyway is just expensive guessing with extra steps.
Set your criteria before the test. Check them after. Make the call with both numbers in hand.
