

Branded search looks like easy money: cheap clicks, sky-high conversion rates and glowing ROI reports. But the intent is already there — those customers were searching for you anyway.
Attribution makes things even murkier. Ads often take credit from direct traffic, organic listings, or even offline campaigns that drove the search in the first place. The dashboard looks great, but the value might be overstated.
That’s why clicks and conversions aren’t the full story. The real question is:
“How many of those conversions happened because of branded search, not just through it?”
Answering that shifts the conversation from surface-level performance to true business impact.
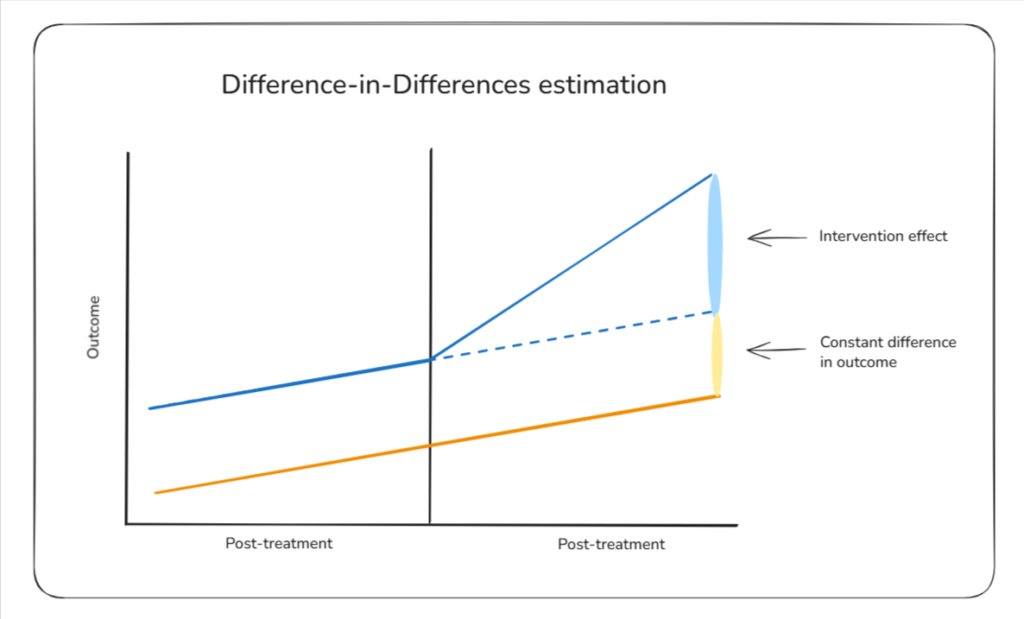
Using Difference-in-Differences (DiD) to measure branded search
If branded search looks inflated in your attribution reports, the next step is to find a method that separates real impact from noise. That’s where Difference-in-Differences (DiD) comes in.
At its core, DiD compares how a ‘test’ group that gets a treatment changes over time versus a ‘control’ group that didn’t get the treatment. The difference between those two changes is the incremental effect.
Think of it as a before-and-after picture with a built-in counterfactual. If your test group behaves differently from the control after the change, the gap that you see in the outcome is the causal effect.
Economists use this technique constantly – from studying minimum wage laws to evaluating tax policies – because it works in messy, real-world settings where you can’t run a perfect experiment. That makes it a great fit for marketing too.
So how does this apply to branded search?
The test is straightforward: reduce or pause branded search spend in a set of ‘test’ markets. The ‘control’ is where spend stays the same. By comparing how performance shifts across both groups, you can isolate the true impact of branded search.
The challenge lies in picking the right control group.
The control group should mirror the test group as closely as possible. Same seasonality, same competitive pressures, same demand trends. Sometimes analysts even build a ‘synthetic control’ by combining multiple potential control groups into one single control group.
For the Difference-in-Differences method to work, one assumption is critical: parallel trends.
In plain terms, if nothing had changed, the test and control groups would have moved in the same direction. If that assumption breaks, the results can be misleading.
Done well, though, DiD takes branded search from gut feel to measurable business impact, showing you what’s incremental and what’s just noise.
Setting up the experiment
The cleanest way to test branded search incrementality is with a geo-split design. Instead of flipping branded search on and off everywhere, you divide your markets into test and control groups.
In the test markets, you reduce or pause branded search spend; in the control markets, everything stays the same. This creates the contrast you need for a proper DiD analysis.
Why geo-splits work
Geo-splits let you run the test without disrupting your entire business. They also help you avoid the bias of time-based designs, where seasonal shifts or competitor activity could muddy the results.
With well-matched geographies, the only systematic difference between test and control should be your branded search treatment.
Choosing the right KPIs
The key is to measure outcomes that reflect incremental business impact, not vanity metrics. Clicks on branded keywords won’t tell you much — they’ll naturally drop in the test markets.
Instead, focus on downstream KPIs like revenue, sales volume, or total conversions across all channels. If those stay flat after you cut branded spend, that’s a sign those ads weren’t adding much incremental value.
Analyzing the Results
Once the experiment is set up, the analysis follows a simple three-step logic.
Step 1: Calculate pre- and post-treatment differences.
Measure how your KPI (e.g., revenue or conversions) changed in both the test and control groups before and after branded search spend was reduced.
Step 2: Compare test vs. control differences.
Subtract the change in the control group from the change in the test group. This removes noise from seasonality or broader market shifts.
Step 3: Interpret the effect size.
If sales in the test markets dropped more than in the control, branded search was adding incremental value. If there’s little to no gap, branded search may have been cannibalizing conversions that would have happened anyway.
A simple way to visualize this is with a before-and-after chart showing performance in both groups. For more precision, many analysts run a regression, which produces the same estimate but with confidence intervals that show how certain the result is.
Pitfalls and limitations
DiD is powerful, but it’s not bulletproof. A few common traps can undermine results:
- When parallel trends don’t hold. If your test and control groups were on different trajectories before the experiment, the results won’t be reliable.
- Spillovers between groups. A national TV campaign or even geographic “bleed” can influence both test and control, eroding the clean separation.
- Low statistical power. If the test covers only a small region or runs for too short a time, random noise can swamp the signal.
- Interpreting results with caution. DiD is still a causal inference method with assumptions. If those assumptions fail, you might mistake correlation for causation.
Handled carefully, DiD can bring clarity to branded search measurement — but it works best when paired with a critical eye and a recognition of its limits.
Key Takeaways
Branded search can feel like a guaranteed win, but clicks and conversions alone don’t tell the full story. Not every branded search impression drives incremental revenue — some just capture demand that already existed.
Difference-in-Differences gives marketers a practical, data-driven way to separate real impact from noise. By comparing test and control groups over time, it shows what’s truly adding value and what isn’t.
For the clearest picture, DiD works best alongside other measurement approaches — geo-experiments, MMM, or lift studies — giving you multiple lenses on branded search performance. When used thoughtfully, it turns guesswork into actionable insight.
