

Most marketers who use Robyn understand what it produces. Fewer understand how it works. That gap matters because it is the difference between reading an output and knowing whether to trust it.
Marketing mix modelling has existed for decades. What changed recently is access. Robyn is Meta’s open-source MMM solution, which means any team with data and an analyst can now run models that previously required expensive consultancies and months of work.
But access without understanding is dangerous. A model that tells you paid social drives 34% of your revenue sounds authoritative. Whether you should act on that number depends entirely on understanding what assumptions went into producing it, and where the model might be wrong.
This article explains how Robyn actually works, what it is good at, where it falls short, and what questions to ask before making budget decisions based on its outputs.
What Robyn is actually doing
At its core, Robyn is a regression model. It takes your marketing spend across channels, your business outcomes like revenue or sales, and external factors like seasonality, and builds a statistical formula that estimates how much each input contributes to the output.
Before the model sees your data, Robyn runs it through three preparation stages. First it decomposes seasonality using a tool called Prophet, which separates your data into long-term trends, yearly cycles, weekly patterns, and holiday effects. This means the model does not confuse your Q4 sales spike with the effectiveness of your December campaigns.
Then it applies two transformations to your media spend that are the most important things to understand about how Robyn works.
The two transformations that matter most
Adstock transformations model the fact that advertising has a delayed effect. Saturation curves model the fact that each additional euro you spend returns less than the last. Together these two adjustments are what separate a serious MMM from a basic regression on your spend data.
Adstock: why yesterday’s ads still matter today
A TV campaign that runs in October does not only drive sales in October. Brand awareness builds. People see the ad, remember the brand, and convert weeks later. A model that only looks at spend in the same week as the sale will systematically undervalue channels with long carryover effects and overvalue channels with short ones.
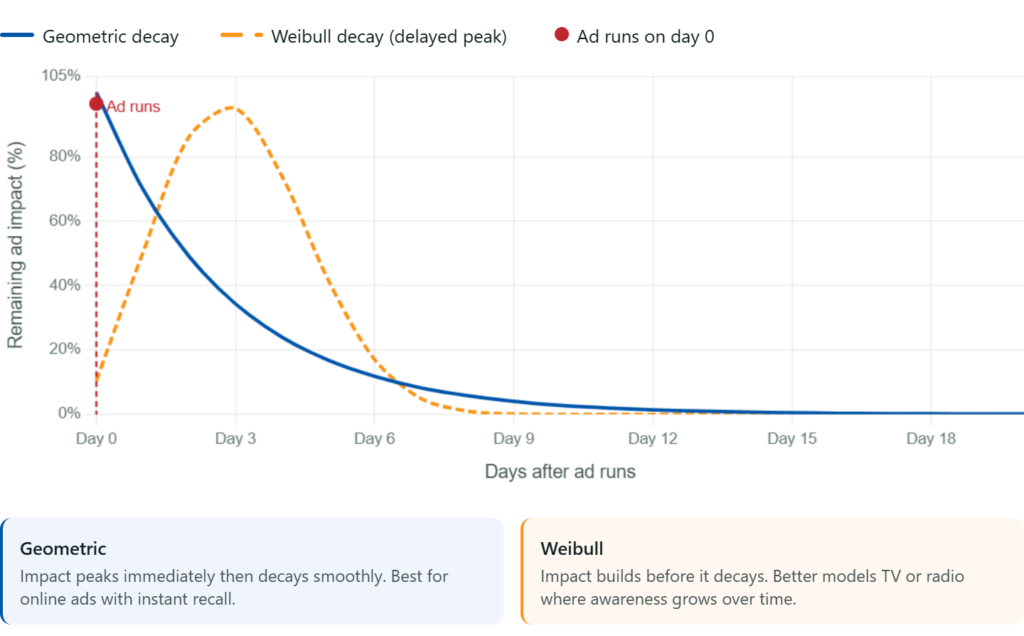
Robyn handles this with adstock transformations. The model assumes that the effect of a marketing activity decays over time rather than disappearing instantly, and it learns the right decay rate from your historical data. Robyn offers two decay functions: geometric decay for digital channels with immediate effect, and Weibull decay for channels like TV or radio where awareness builds before it translates into action.
Why this matters for your budget
If your model uses no adstock transformation, it tells you your TV spend drove almost nothing because the sales happened weeks after the campaign.
You cut TV, double down on paid search, and wonder why brand awareness starts falling. The model was not wrong about the data. It was wrong about time.
Saturation: where your spend stops working
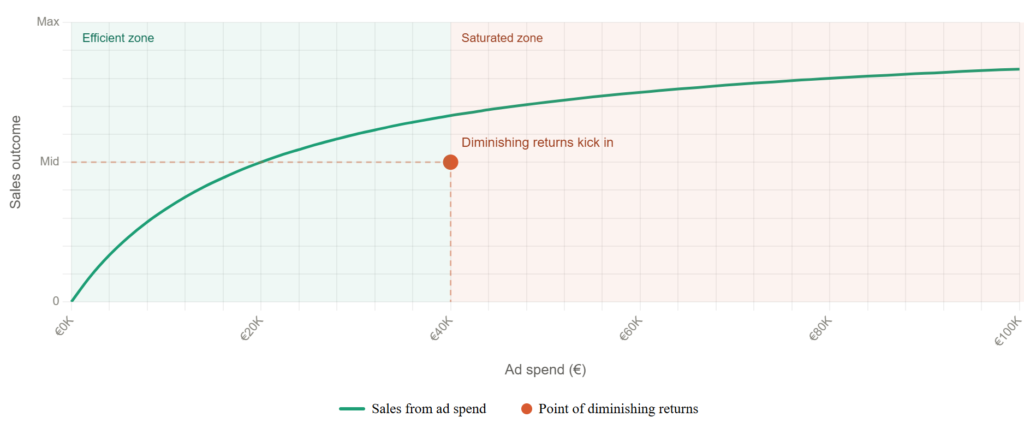
The second transformation is saturation. Robyn assumes that marketing channels hit diminishing returns. The first thousand euros you spend on a channel drives more revenue than the ten-thousandth. This is almost always true in practice, and ignoring it produces badly wrong budget recommendations.
Robyn models saturation with a Hill function, producing the classic curve shape: steep returns at low spend levels that flatten as investment increases. The model learns where your specific channels sit on that curve from your historical data.
How Robyn avoids making things up
One real risk with any regression model on marketing data is overfitting. A model that fits your historical data perfectly is often useless for forward-looking decisions because it memorised noise rather than learned real relationships. Robyn addresses this in three ways.
What data you actually need
Robyn needs weekly or daily data spanning at least two years. That requirement is not arbitrary. The model needs to observe enough variability in your spend and outcomes to isolate the effect of individual channels. If you ran broadly the same media mix for two years without significant changes, the model will struggle to separate what each channel contributes independently.
Below roughly two million euros in annual media spend, the statistical signal is often too weak for Robyn to reliably separate individual channel effects. The model will run, but the confidence intervals will be wide enough to make specific budget recommendations unreliable. If you sit below this threshold, a geo-experiment will usually give you more actionable answers.
Where Robyn falls short
What to do with the output
Robyn produces two things you should focus on: channel contribution estimates and budget optimisation recommendations.
Channel contributions tell you how much of your historical revenue each channel drove. Use these directionally, not as precise figures. The confidence intervals matter as much as the point estimates. A channel attributed with 15% contribution but a confidence interval of 8 to 22% is a very different finding from one with a tight range of 13 to 17%.
Budget optimisation recommendations show you where the model thinks you are over and underinvesting relative to each channel’s saturation curve. A recommendation to reduce spend on a saturated channel while increasing spend on an undersaturated one is exactly the kind of insight that justifies running MMM in the first place.
Always validate Robyn’s outputs against at least one other measurement method before making significant budget shifts. A geo-experiment that confirms a channel’s incrementality alongside a Robyn model that shows healthy saturation headroom gives you a far more defensible case than either method alone.
