
Branded SEA looks like easy money. Cheap clicks, high conversion rates, great ROI. But a lot of those conversions were going to happen anyway, and your attribution tool is almost certainly taking credit for them.
Most marketing teams never question branded search. The cost-per-acquisition looks great. Leadership is happy. The budget stays, or grows.
But there is a question worth asking. How many of those conversions happened because of branded search, and how many just happened through it?
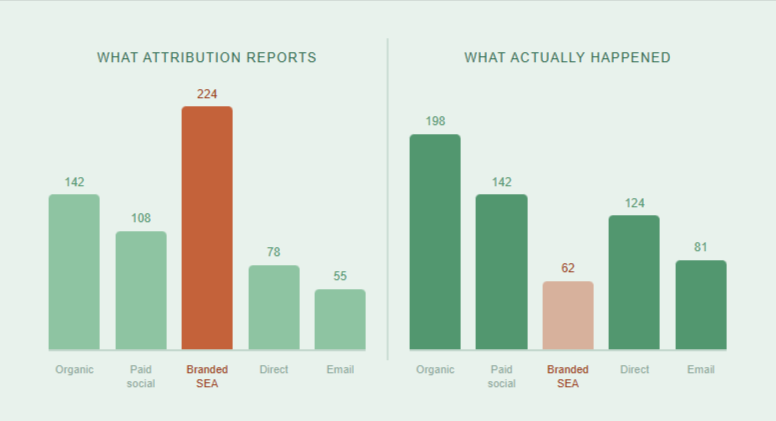
Picture this. Someone already knows your brand. They already decided to buy. They Google your name, click your ad, and convert. Your attribution tool reports a branded search conversion. But that person was coming regardless. You paid for a click you did not need.
The gap between what attribution reports and what actually happened is called incrementality. Measuring it shifts the conversation from “branded search performs well” to “branded search earns its budget.” That is a very different standard, and it matters when you are defending spend.
The core question
Not “how many conversions came through branded search?” Ask instead: “how many conversions happened because of branded search that would not have happened otherwise?”
Why attribution cannot answer this, and what can
Attribution models track the path to conversion. Last click, data-driven, even multi-touch attribution all assign credit to touchpoints along that path. They do that job reasonably well. What they cannot do is answer counterfactual questions.
A counterfactual question sounds like this: what would have happened if this touchpoint had never existed? That is precisely what you need to know about branded search. And attribution has no mechanism to answer it.
So you need a different method. Difference-in-Differences, or DiD, is the right tool here. Economists have used it for decades to study minimum wage effects, tax policy changes, and public health interventions. It works in messy real-world settings where running a clean controlled experiment is impossible. Marketing fits that description perfectly.
The logic runs like this. You split your markets into two groups. In the test group, you reduce or pause branded search spend. In the control group, everything stays the same. You measure what happens to your key business metrics in both groups before and after the change. Then you compare the two changes. That comparison gives you your causal estimate of what branded search was actually contributing.
“A before-and-after picture with a built-in counterfactual.”
If the test markets barely notice the change and sales hold steady, branded search was not driving incremental demand. If test markets drop meaningfully against the control, it was genuinely pulling in conversions you would otherwise have lost.
How to design the test without disrupting your business
A geo-split is the cleanest setup. You divide your markets geographically, cut branded spend in the test group, and leave everything else untouched in the control. You can run this without touching national campaigns or triggering conversations you are not ready to have yet.
Picking your control group
Most DiD experiments break here. Your control group needs to closely mirror your test group. Same seasonality, similar competitive environment, comparable revenue baseline. If Amsterdam spikes every Q4 and Rotterdam does not, they make a poor pair.
When no single region matches cleanly, analysts build a synthetic control. You take a weighted blend of multiple regions that, together, track your test region’s historical behaviour. It takes more work upfront. It produces more reliable results.
What to measure
Do not measure branded clicks or branded conversions. Those will obviously drop in the test markets. That drop tells you nothing useful. Measure downstream business outcomes instead: total revenue, total conversions across all channels, new customer acquisitions. If those hold steady after you cut branded spend, the ads were capturing demand that would have found you through organic search or direct traffic anyway.
Running the analysis in three steps
Four things that can break your results
What to do with the answer
You run the test. You get a number. Now use it.
If incrementality is high, say 60 to 70 percent of branded conversions are genuinely additional, you have a strong and defensible case to protect that spend. Bring the number into your next budget conversation. Let the evidence speak.
If incrementality is low, around 20 to 30 percent, you are looking at a meaningful pool of budget that could move to channels that actually generate demand. Shifting even 30 percent of branded spend into prospecting or upper-funnel activity could materially improve your overall return on investment.
Either result is a good result. You replace a gut feeling with a number you can act on. That is the whole point.
The bottom line
If branded search earns its budget, this test proves it. If it does not, you just found money to reallocate.
Difference-in-Differences gives you a practical, defensible way to answer a question most teams never ask. Pair it with MMM or lift studies for additional lenses on the same problem. But for branded search specifically, a well-run geo-split DiD gives you the clearest answer available.
Run the test. Know your number. Make the call.
